Categories
Offsites

Using Variational Transformer Networks to Automate Document Layout Design

Information in a written document is not only conveyed by the meaning of the words contained in it, but also by the overall document layout. Layouts are commonly used to direct the order in which the reader parses a document to enable a better understanding (e.g., with columns or paragraphs), to provide helpful summaries (e.g., with titles) or for aesthetic purposes (e.g., when displaying advertisements).

While these design rules are easy to follow, it is difficult to explicitly define them without quickly needing to include exceptions or encountering ambiguous cases. This makes the automation of document design difficult, as any system with a hardcoded set of production rules will either be overly simplistic and thus incapable of producing original layouts (causing a lack of diversity in the layout of synthesized data), or too complex, with a large set of rules and their accompanying exceptions. In an attempt to solve this challenge, some have proposed machine learning (ML) techniques to synthesize document layouts. However, most ML-based solutions for automatic document design do not scale to a large number of layout components, or they rely on additional information for training, such as the relationships between the different components of a document.

In “Variational Transformer Networks for Layout Generation”, to be presented at CVPR 2021, we create a document layout generation system that scales to an arbitrarily large number of elements and does not require any additional information to capture the relationships between design elements. We use self-attention layers as building blocks of a variational autoencoder (VAE), which is able to model document layout design rules as a distribution, rather than using a set of predetermined heuristics, increasing the diversity of the generated layouts. The resulting Variational Transformer Network (VTN) model is able to extract meaningful relationships between the layout elements (paragraphs, tables, images, etc.), resulting in realistic synthetic documents (e.g., better alignment and margins). We show the effectiveness of this combination across different domains, such as scientific papers, UI layouts, and even furniture arrangements.

VAEs for Layout Generation
The ultimate goal of this system is to infer the design rules for a given type of layout from a collection of examples. If one considers these design rules as the distribution underlying the data, it is possible to use probabilistic models to discover it. We propose doing this with a VAE (widely used for tasks like image generation or anomaly detection), an autoencoder architecture that consists of two distinct subparts, the encoder and decoder. The encoder learns to compress the input to fewer dimensions, retaining only the necessary information to reconstruct the input, while the decoder learns to undo this operation. The compressed representation (also called the bottleneck) can be forced to behave like a known distribution (e.g., a uniform Gaussian). Feeding samples from this a priori distribution to the decoder segment of the network results in outputs similar to the training data.

An additional advantage of the VAE formulation is that it is agnostic to the type of operations used to implement the encoder and decoder segments. As such, we use self-attention layers (typically seen in Transformer architectures) to automatically capture the influence that each layout element has over the rest.

Transformers use self-attention layers to model long, sequenced relationships, often applied to an array of natural language understanding tasks, such as translation and summarization, as well as beyond the language domain in object detection or document layout understanding tasks. The self-attention operation relates every element in a sequence to every other and determines how they influence each other. This property is ideal to model relationships across different elements in a layout without the need for explicit annotations.

In order to synthesize new samples from these relationships, some approaches for layout generation [e.g., 1] and even for other domains [e.g., 2, 3] rely on greedy search algorithms, such as beam search, nucleus sampling or top-k sampling. Since these strategies are often based on exploration rules that tend to favor the most likely outcome at every step, the diversity of the generated samples is not guaranteed. However, by combining self-attention with the VAE’s probabilistic techniques, the model is able to directly learn a distribution from which it can extract new elements.

Modeling the Variational Bottleneck
The bottleneck of a VAE is commonly modeled as a vector representing the input. Since self-attention layers are a sequence-to-sequence architecture, i.e., a sequence of n input elements is mapped onto n output elements, the standard VAE formulation is difficult to apply. Inspired by BERT, we append an auxiliary token to the beginning of the sequence and treat it as the autoencoder bottleneck vector z. During training, the vector associated with this token is the only piece of information passed to the decoder, so the encoder needs to learn how to compress the entire document information in this vector. The decoder then learns to infer the number of elements in the document as well as the locations of each element in the input sequence from this vector alone. This strategy allows us to use standard techniques to regularize the bottleneck, such as the KL divergence.

Decoding
In order to synthesize documents with varying numbers of elements, the network needs to model sequences of arbitrary length, which is not trivial. While self-attention enables the encoder to adapt automatically to any number of elements, the decoder segment does not know the number of elements in advance. We overcome this issue by decoding sequences in an autoregressive way — at every step, the decoder produces an element, which is concatenated to the previously decoded elements (starting with the bottleneck vector z as input), until a special stop element is produced.

A visualization of our proposed architecture

Turning Layouts into Input Data
A document is often composed of several design elements, such as paragraphs, tables, images, titles, footnotes, etc. In terms of design, layout elements are often represented by the coordinates of their enclosing bounding boxes. To make this information easily digestible for a neural network, we define each element with four variables (x, y, width, height), representing the element’s location on the page (x, y) and size (width, height).

Results
We evaluate the performance of the VTN following two criteria: layout quality and layout diversity. We train the model on publicly available document datasets, such as PubLayNet, a collection of scientific papers with layout annotations, and evaluate the quality of generated layouts by quantifying the amount of overlap and alignment between elements. We measure how well the synthetic layouts resemble the training distribution using the Wasserstein distance over the distributions of element classes (e.g., paragraphs, images, etc.) and bounding boxes. In order to capture the layout diversity, we find the most similar real sample for each generated document using the DocSim metric, where a higher number of unique matches to the real data indicates a more diverse outcome.

We compare the VTN approach to previous works like LayoutVAE and Gupta et al. The former is a VAE-based formulation with an LSTM backbone, whereas Gupta et al. use a self-attention mechanism similar to ours, combined with standard search strategies (beam search). The results below show that LayoutVAE struggles to comply with design rules, like strict alignments, as in the case of PubLayNet. Thanks to the self-attention operation, Gupta et al. can model these constraints much more effectively, but the usage of beam search affects the diversity of the results.

IoU Overlap Alignment Wasserstein Class ↓ Wasserstein Box ↓ # Unique Matches ↑
LayoutVAE   0.171 0.321 0.472 0.045 241
Gupta et al.   0.039 0.006 0.361 0.018 0.012 546
VTN 0.031 0.017 0.347 0.022 0.012 697
Real Data   0.048 0.007 0.353
Results on PubLayNet. Down arrows (↓) indicate that a lower score is better, whereas up arrows (↑) indicate higher is better.

We also explore the ability of our approach to learn design rules in other domains, such as Android UIs (RICO), natural scenes (COCO) and indoor scenes (SUN RGB-D). Our method effectively learns the design rules of these datasets and produces synthetic layouts of similar quality as the current state of the art and a higher degree of diversity.

IoU Overlap Alignment Wasserstein Class ↓ Wasserstein Box ↓ # Unique Matches ↑
LayoutVAE   0.193 0.400 0.416 0.045 496
Gupta et al.   0.086 0.145 0.366 0.004 0.023 604
VTN 0.115 0.165 0.373 0.007 0.018 680
Real Data   0.084 0.175 0.410
Results on RICO. Down arrows (↓) indicate that a lower score is better, whereas up arrows (↑) indicate higher is better.
IoU Overlap Alignment Wasserstein Class ↓ Wasserstein Box ↓ # Unique Matches ↑
LayoutVAE   0.325 2.819 0.246 0.062 700
Gupta et al.   0.194 1.709 0.334 0.001 0.016 601
VTN 0.197 2.384 0.330 0.0005 0.013 776
Real Data   0.192 1.724 0.347
Results for COCO. Down arrows (↓) indicate that a lower score is better, whereas up arrows (↑) indicate higher is better.

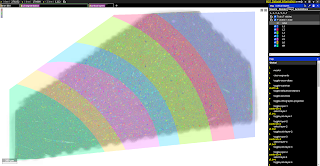
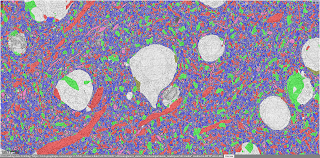
Below are some examples of layouts produced by our method compared to existing methods. The design rules learned by the network (location, margins, alignment) resemble those of the original data and show a high degree of variability.

LayoutVAE  
Gupta et al.  
VTN
Qualitative results of our method on PubLayNet compared to existing state-of-the-art methods.

Conclusion
In this work we show the feasibility of using self-attention as part of the VAE formulation. We validate the effectiveness of this approach for layout generation, achieving state-of-the-art performance on various datasets and across different tasks. Our research paper also explores alternative architectures for the integration of self-attention and VAEs, exploring non-autoregressive decoding strategies and different types of priors, and analyzes advantages and disadvantages. The layouts produced by our method can help to create synthetic training data for downstream tasks, such as document parsing or automating graphic design tasks. We hope that this work provides a foundation for continued research in this area, as many subproblems are still not completely solved, such as how to suggest styles for the elements in the layout (text font, which image to choose, etc.) or how to reduce the amount of training data necessary for the model to generalize.

AcknowledgementsWe thank our co-author Janis Postels, as well as Alessio Tonioni and Luca Prasso for helping with the design of several of our experiments. We also thank Tom Small for his help creating the animations for this post.

Categories
Offsites

Extending Contrastive Learning to the Supervised Setting

In recent years, self-supervised representation learning, which is used in a variety of image and video tasks, has significantly advanced due to the application of contrastive learning. These contrastive learning approaches typically teach a model to pull together the representations of a target image (a.k.a., the “anchor”) and a matching (“positive”) image in embedding space, while also pushing apart the anchor from many non-matching (“negative”) images. Because labels are assumed to be unavailable in self-supervised learning, the positive is often an augmentation of the anchor, and the negatives are chosen to be the other samples from the training minibatch. However, because of this random sampling, false negatives, i.e., negatives generated from samples of the same class as the anchor, can cause a degradation in the representation quality. Furthermore, determining the optimal method to generate positives is still an area of active research.

In contrast to the self-supervised approach, a fully-supervised approach could use labeled data to generate positives from existing same-class examples, providing more variability in pretraining than could typically be achieved by simply augmenting the anchor. However, very little work has been done to successfully apply contrastive learning in the fully-supervised domain.

In “Supervised Contrastive Learning”, presented at NeurIPS 2020, we propose a novel loss function, called SupCon, that bridges the gap between self-supervised learning and fully supervised learning and enables contrastive learning to be applied in the supervised setting. Leveraging labeled data, SupCon encourages normalized embeddings from the same class to be pulled closer together, while embeddings from different classes are pushed apart. This simplifies the process of positive selection, while avoiding potential false negatives. Because it accommodates multiple positives per anchor, this approach results in an improved selection of positive examples that are more varied, while still containing semantically relevant information. SupCon also allows label information to play an active role in representation learning rather than restricting it to be used only in downstream training, as is the case for conventional contrastive learning. To the best of our knowledge, this is the first contrastive loss to consistently perform better on large-scale image classification problems than the common approach of using cross-entropy loss to train the model directly. Importantly, SupCon is straightforward to implement and stable to train, provides consistent improvement to top-1 accuracy for a number of datasets and architectures (including Transformer architectures), and is robust to image corruptions and hyperparameter variations.

Self-supervised (left) vs supervised (right) contrastive losses: The self-supervised contrastive loss contrasts a single positive for each anchor (i.e., an augmented version of the same image) against a set of negatives consisting of the entire remainder of the minibatch. The supervised contrastive loss considered in this paper, however, contrasts the set of all samples from the same class as positives against the negatives from the remainder of the batch.

The Supervised Contrastive Learning Framework
SupCon can be seen as a generalization of both the SimCLR and N-pair losses — the former uses positives generated from the same sample as that of the anchor, and the latter uses positives generated from different samples by exploiting known class labels. The use of many positives and many negatives for each anchor allows SupCon to achieve state-of-the-art performance without the need for hard negative mining (i.e., searching for negatives similar to the anchor), which can be difficult to tune properly.

SupCon subsumes multiple losses from the literature and is a generalization of the SimCLR and N-Pair losses.

This method is structurally similar to those used in self-supervised contrastive learning, with modifications for supervised classification. Given an input batch of data, we first apply data augmentation twice to obtain two copies, or “views,” of each sample in the batch (though one could create and use any number of augmented views). Both copies are forward propagated through an encoder network, and the resulting embedding is then L2-normalized. Following standard practice, the representation is further propagated through an optional projection network to help identify meaningful features. The supervised contrastive loss is computed on the normalized outputs of the projection network. Positives for an anchor consist of the representations originating from the same batch instance as the anchor or from other instances with the same label as the anchor; the negatives are then all remaining instances. To measure performance on downstream tasks, we train a linear classifier on top of the frozen representations.

Cross-entropy, self-supervised contrastive loss and supervised contrastive loss Left: The cross-entropy loss uses labels and a softmax loss to train a classifier. Middle: The self-supervised contrastive loss uses a contrastive loss and data augmentations to learn representations. Right: The supervised contrastive loss also learns representations using a contrastive loss, but uses label information to sample positives in addition to augmentations of the same image.

Key Findings
SupCon consistently boosts top-1 accuracy compared to cross-entropy, margin classifiers (with use of labels), and self-supervised contrastive learning techniques on CIFAR-10 and CIFAR-100 and ImageNet datasets. With SupCon, we achieve excellent top-1 accuracy on the ImageNet dataset with the ResNet-50 and ResNet-200 architectures. On ResNet-200, we achieve a top-1 accuracy of 81.4%, which is a 0.8% improvement over the state-of-the-art cross-entropy loss using the same architecture (which represents a significant advance for ImageNet). We also compared cross-entropy and SupCon on a Transformer-based ViT-B/16 model and found a consistent improvement over cross-entropy (77.8% versus 76% for ImageNet; 92.6% versus 91.6% for CIFAR-10) under the same data augmentation regime (without any higher-resolution fine-tuning).

The SupCon loss consistently outperforms cross-entropy with standard data augmentation strategies (AutoAugment, RandAugment and CutMix). We show top-1 accuracy for ImageNet, on ResNet-50, ResNet-101 and ResNet200.

We also demonstrate analytically that the gradient of our loss function encourages learning from hard positives and hard negatives. The gradient contributions from hard positives/negatives are large while those for easy positives/negatives are small. This implicit property allows the contrastive loss to sidestep the need for explicit hard mining, which is a delicate but critical part of many losses, such as triplet loss. See the supplementary material of our paper for a full derivation.

SupCon is also more robust to natural corruptions, such as noise, blur and JPEG compression. The mean Corruption Error (mCE) measures the average degradation in performance compared to the benchmark ImageNet-C dataset. The SupCon models have lower mCE values across different corruptions compared to cross-entropy models, showing increased robustness.

We show empirically that the SupCon loss is less sensitive than cross-entropy to a range of hyperparameters. Across changes in augmentations, optimizers, and learning rates, we observe significantly lower variance in the output of the contrastive loss. Moreover, applying different batch sizes while holding all other hyperparameters constant results in consistently better top-1 accuracy of SupCon to that of cross-entropy at each batch size.

Accuracy of cross-entropy and supervised contrastive loss as a function of hyperparameters and training data size, measured on ImageNet with a ResNet-50 encoder. Left: Boxplot showing Top-1 accuracy vs changes in augmentation, optimizer and learning rates. SupCon yields more consistent results across variations in each, which is useful when the best strategies are unknown a priori. Right: Top-1 accuracy as a function of batch size shows both losses benefit from larger batch sizes while SupCon has higher Top-1 accuracy, even when trained with small batch sizes.
Accuracy of supervised contrastive loss as a function of training duration and the temperature hyperparameter, measured on ImageNet with a ResNet-50 encoder. Left: Top-1 accuracy as a function of SupCon pre-training epochs. Right: Top-1 accuracy as a function of temperature during the pre-training stage for SupCon. Temperature is an important hyperparameter in contrastive learning and reducing sensitivity to temperature is desirable.

Broader Impact and Next Steps
This work provides a technical advancement in the field of supervised classification. Supervised contrastive learning can improve both the accuracy and robustness of classifiers with minimal complexity. The classic cross-entropy loss can be seen as a special case of SupCon where the views correspond to the images and the learned embeddings in the final linear layer corresponding to the labels. We note that SupCon benefits from large batch sizes, and being able to train the models on smaller batches is an important topic for future research.

Our Github repository includes Tensorflow code to train the models in the paper. Our pre-trained models are also released on TF-Hub.

Acknowledgements
The NeurIPS paper was jointly co-authored with Prannay Khosla, Piotr Teterwak, Chen Wang, Aaron Sarna, Yonglong Tian, Phillip Isola, Aaron Maschinot, Ce Liu, and Dilip Krishnan. Special thanks to Jenny Huang for leading the writing process for this blogpost.

Categories
Offsites

Data Cascades in Machine Learning

Data is a foundational aspect of machine learning (ML) that can impact performance, fairness, robustness, and scalability of ML systems. Paradoxically, while building ML models is often highly prioritized, the work related to data itself is often the least prioritized aspect. This data work can require multiple roles (such as data collectors, annotators, and ML developers) and often involves multiple teams (such as database, legal, or licensing teams) to power a data infrastructure, which adds complexity to any data-related project. As such, the field of human-computer interaction (HCI), which is focused on making technology useful and usable for people, can help both to identify potential issues and to assess the impact on models when data-related work is not prioritized.

In “‘Everyone wants to do the model work, not the data work’: Data Cascades in High-Stakes AI”, published at the 2021 ACM CHI Conference, we study and validate downstream effects from data issues that result in technical debt over time (defined as “data cascades”). Specifically, we illustrate the phenomenon of data cascades with the data practices and challenges of ML practitioners across the globe working in important ML domains, such as cancer detection, landslide detection, loan allocation and more — domains where ML systems have enabled progress, but also where there is opportunity to improve by addressing data cascades. This work is the first that we know of to formalize, measure, and discuss data cascades in ML as applied to real-world projects. We further discuss the opportunity presented by a collective re-imagining of ML data as a high priority, including rewarding ML data work and workers, recognizing the scientific empiricism in ML data research, improving the visibility of data pipelines, and improving data equity around the world.

Origins of Data Cascades
We observe that data cascades often originate early in the lifecycle of an ML system, at the stage of data definition and collection. Cascades also tend to be complex and opaque in diagnosis and manifestation, so there are often no clear indicators, tools, or metrics to detect and measure their effects. Because of this, small data-related obstacles can grow into larger and more complex challenges that affect how a model is developed and deployed. Challenges from data cascades include the need to perform costly system-level changes much later in the development process, or the decrease in users’ trust due to model mis-predictions that result from data issues. Nevertheless and encouragingly, we also observe that such data cascades can be avoided through early interventions in ML development.

Different color arrows indicate different types of data cascades, which typically originate upstream, compound over the ML development process, and manifest downstream.

Examples of Data Cascades
One of the most common causes of data cascades is when models that are trained on noise-free datasets are deployed in the often-noisy real world. For example, a common type of data cascade originates from model drifts, which occur when target and independent variables deviate, resulting in less accurate models. Drifts are more common when models closely interact with new digital environments — including high-stakes domains, such as air quality sensing, ocean sensing, and ultrasound scanning — because there are no pre-existing and/or curated datasets. Such drifts can lead to more factors that further decrease a model’s performance (e.g., related to hardware, environmental, and human knowledge). For example, to ensure good model performance, data is often collected in controlled, in-house environments. But in the live systems of new digital environments with resource constraints, it is more common for data to be collected with physical artefacts such as fingerprints, shadows, dust, improper lighting, and pen markings, which can add noise that affects model performance. In other cases, environmental factors such as rain and wind can unexpectedly move image sensors in deployment, which also trigger cascades. As one of the model developers we interviewed reported, even a small drop of oil or water can affect data that could be used to train a cancer prediction model, therefore affecting the model’s performance. Because drifts are often caused by the noise in real-world environments, they also take the longest — up to 2-3 years — to manifest, almost always in production.

Another common type of data cascade can occur when ML practitioners are tasked with managing data in domains in which they have limited expertise. For instance, certain kinds of information, such as identifying poaching locations or data collected during underwater exploration, rely on expertise in the biological sciences, social sciences, and community context. However, some developers in our study described having to take a range of data-related actions that surpassed their domain expertise — e.g., discarding data, correcting values, merging data, or restarting data collection — leading to data cascades that limited model performance. The practice of relying on technical expertise more than domain expertise (e.g., by engaging with domain experts) is what appeared to set off these cascades.

Two other cascades observed in this paper resulted from conflicting incentives and organizational practices between data collectors, ML developers, and other partners — for example, one cascade was caused by poor dataset documentation. While work related to data requires careful coordination across multiple teams, this is especially challenging when stakeholders are not aligned on priorities or workflows.

How to Address Data Cascades
Addressing data cascades requires a multi-part, systemic approach in ML research and practice:

  1. Develop and communicate the concept of goodness of the data that an ML system starts with, similar to how we think about goodness of fit with models. This includes developing standardized metrics and frequently using those metrics to measure data aspects like phenomenological fidelity (how accurately and comprehensively does the data represent the phenomena) and validity (how well the data explains things related to the phenomena captured by the data), similar to how we have developed good metrics to measure model performance, like F1-scores.
  2. Innovate on incentives to recognize work on data, such as welcoming empiricism on data in conference tracks, rewarding dataset maintenance, or rewarding employees for their work on data (collection, labelling, cleaning, or maintenance) in organizations.
  3. Data work often requires coordination across multiple roles and multiple teams, but this is quite limited currently (partly, but not wholly, because of the previously stated factors). Our research points to the value of fostering greater collaboration, transparency, and fairer distribution of benefits between data collectors, domain experts, and ML developers, especially with ML systems that rely on collecting or labelling niche datasets.
  4. Finally, our research across multiple countries indicates that data scarcity is pronounced in lower-income countries, where ML developers face the additional problem of defining and hand-curating new datasets, which makes it difficult to even start developing ML systems. It is important to enable open dataset banks, create data policies, and foster ML literacy of policy makers and civil society to address the current data inequalities globally.

Conclusion
In this work we both provide empirical evidence and formalize the concept of data cascades in ML systems. We hope to create an awareness of the potential value that could come from incentivising data excellence. We also hope to introduce an under-explored but significant new research agenda for HCI. Our research on data cascades has led to evidence-backed, state-of-the-art guidelines for data collection and evaluation in the revised PAIR Guidebook, aimed at ML developers and designers.

Acknowledgements
This paper was written in collaboration with Shivani Kapania, Hannah Highfill, Diana Akrong, Praveen Paritosh and Lora Aroyo. We thank our study participants, and Sures Kumar Thoddu Srinivasan, Jose M. Faleiro, Kristen Olson, Biswajeet Malik, Siddhant Agarwal, Manish Gupta, Aneidi Udo-Obong, Divy Thakkar, Di Dang, and Solomon Awosupin.

Categories
Offsites

Toward Generalized Sim-to-Real Transfer for Robot Learning

Reinforcement and imitation learning methods in robotics research can enable autonomous environmental navigation and efficient object manipulation, which in turn opens up a breadth of useful real-life applications. Previous work has demonstrated how robots that learn end-to-end using deep neural networks can reliably and safely interact with the unstructured world around us by comprehending camera observations to take actions and solve tasks. However, while end-to-end learning methods can generalize and scale for complicated robot manipulation tasks, they require hundreds of thousands real world robot training episodes, which can be difficult to obtain. One can attempt to alleviate this constraint by using a simulation of the environment that allows virtual robots to learn more quickly and at scale, but the simulations’ inability to exactly match the real world presents a challenge c ommonly referred to as the sim-to-real gap. One important source of the gap comes from discrepancies between the images rendered in simulation and the real robot camera observations, which then causes the robot to perform poorly in the real world.

To-date, work on bridging this gap has employed a technique called pixel-level domain adaptation, which translates synthetic images to realistic ones at the pixel level. One example of this technique is GraspGAN, which employs a generative adversarial network (GAN), a framework that has been very effective at image generation, to model this transformation between simulated and real images given datasets of each domain. These pseudo-real images correct some sim-to-real gap, so policies learned with simulation execute more successfully on real robots. A limitation for their use in sim-to-real transfer, however, is that because GANs translate images at the pixel-level, multi-pixel features or structures that are necessary for robot task learning may be arbitrarily modified or even removed.

To address the above limitation, and in collaboration with the Everyday Robot Project at X, we introduce two works, RL-CycleGAN and RetinaGAN, that train GANs with robot-specific consistencies — so that they do not arbitrarily modify visual features that are specifically necessary for robot task learning — and thus bridge the visual discrepancy between sim and real. We demonstrate how these consistencies preserve features critical to policy learning, eliminating the need for hand-engineered, task-specific tuning, which in turn allows for this sim-to-real methodology to work flexibly across tasks, domains, and learning algorithms. With RL-CycleGAN, we describe our sim-to-real transfer methodology and demonstrate state-of-the-art performance on real world grasping tasks trained with RL. With RetinaGAN, we extend our approach to include imitation learning with a door opening task.

RL-CycleGAN
In “RL-CycleGAN: Reinforcement Learning Aware Simulation-To-Real”, we leverage a variation of CycleGAN for sim-to-real adaptation by ensuring consistency of task-relevant features between real and simulated images. CycleGAN encourages preservation of image contents by ensuring an adapted image transformed back to the original domain is identical to the original image, which is called cycle consistency. To further encourage the adapted images to be useful for robotics, the CycleGAN is jointly trained with a reinforcement learning (RL) robot agent that ensures the robot’s actions are the same given both the original images and those after GAN-adaptation. That is, task-specific features like robot arm or graspable object locations are unaltered, but the GAN may still alter lighting or textural differences between domains that do not affect task-level decisions.

Evaluating RL-CycleGAN
We evaluated RL-CycleGAN on a robotic indiscriminate grasping task. Trained on 580,000 real trials and simulations adapted with RL-CycleGAN, the robot grasps objects with 94% success, surpassing the 89% success rate of the prior state-of-the-art sim-to-real method GraspGAN and the 87% mark using real-only data without simulation. With only 28,000 trials, the RL-CycleGAN method reaches 86%, comparable to the previous baselines with 20x the data. Some examples of the RL-CycleGAN output alongside the simulation images are shown below.

Comparison between simulation images of robot grasping before (left) and after RL-CycleGAN translation (right).

RetinaGAN
While RL-CycleGAN reliably transfers from sim-to-real for the RL domain using task awareness, a natural question arises: can we develop a more flexible sim-to-real transfer technique that applies broadly to different tasks and robot learning techniques?

In “RetinaGAN: An Object-Aware Approach to Sim-to-Real Transfer”, presented at ICRA 2021, we develop such a task-decoupled, algorithm-decoupled GAN approach to sim-to-real transfer by instead focusing on robots’ perception of objects. RetinaGAN enforces strong object-semantic awareness through perception consistency via object detection to predict bounding box locations for all objects on all images. In an ideal sim-to-real model, we expect the object detector to predict the same box locations before and after GAN translation, as objects should not change structurally. RetinaGAN is trained toward this ideal by backpropagation, such that there is consistency in perception of objects both when a) simulated images are transformed from simulation to real and then back to simulation and b) when real images are transformed from real to simulation and then back to real. We find this object-based consistency to be more widely applicable than the task-specific consistency required by RL-CycleGAN.

Diagram of RetinaGAN stages. The simulated image (top left) is transformed by the sim-to-real generator and subsequently by the real-to-sim generator. The real image (bottom left) undergoes the transformation in reverse order. Having separate pipelines that start with the simulated and real images improves the GAN’s performance.

Evaluating RetinaGAN on a Real Robot
Given the goal of building a more flexible sim-to-real transfer technique, we evaluate RetinaGAN in multiple ways to understand for which tasks and under what conditions it accomplishes sim-to-real transfer.

We first apply RetinaGAN to a grasping task. As demonstrated visually below, RetinaGAN emphasizes the translation of realistic object textures, shadows, and lighting, while maintaining the visual quality and saliency of the graspable objects. We couple a pre-trained RetinaGAN model with the distributed reinforcement learning method Q2-Opt to train a vision-based task model for instance grasping. On real robots, this policy grasps object instances with 80% success when trained on a hundred thousand episodes — outperforming prior adaptation methods RL-CycleGAN and CycleGAN (both achieving ~68%) and training without domain adaptation (grey bars below: 19% with sim data, 22% with real data, and 54% with mixed data). This gives us confidence that perception consistency is a valuable strategy for sim-to-real transfer. Further, with just 10,000 training episodes (8% of the data), the RL policy with RetinaGAN grasps with 66% success, demonstrating performance of prior methods with significantly less data.

Evaluation performance of RL policies on instance grasping, trained with various datasets and sim-to-real methods. Low-Data RetinaGAN uses 8% of the real dataset.
The simulated grasping environment (left) is translated to a realistic image (right) using RetinaGAN.

Next, we pair RetinaGAN with a different learning method, behavioral cloning, to open conference room doors given demonstrations by human operators. Using images from both simulated and real demonstrations, we train RetinaGAN to translate the synthetic images to look realistic, bridging the sim-to-real gap. We then train a behavior cloning model to imitate the task-solving actions of the human operators within real and RetinaGAN-adapted sim demonstrations. When evaluating this model by predicting actions to take, the robot enters real conference rooms over 93% of the time, surpassing baselines of 75% and below.

Both of the above images show the same simulation, but RetinaGAN translates simulated door opening images (left) to look more like real robot sensor data (right).
Three examples of the real robot successfully opening conference room doors using the RetinaGAN-trained behavior cloning policy.

Conclusion
This work has demonstrated how additional constraints on GANs may address the visual sim-to-real gap without requiring task-specific tuning; these approaches reach higher real robot success rates with less data collection. RL-CycleGAN translates synthetic images to realistic ones with an RL-consistency loss that automatically preserves task-relevant features. RetinaGAN is an object-aware sim-to-real adaptation technique that transfers robustly across environments and tasks, agnostic to the task learning method. Since RetinaGAN is not trained with any task-specific knowledge, we show how it can be reused for a novel object pushing task. We hope that work on the sim-to-real gap further generalizes toward solving task-agnostic robotic manipulation in unstructured environments.

Acknowledgements
Research into RL-CycleGAN was conducted by Kanishka Rao, Chris Harris, Alex Irpan, Sergey Levine, Julian Ibarz, and Mohi Khansari. Research into RetinaGAN was conducted by Daniel Ho, Kanishka Rao, Zhuo Xu, Eric Jang, Mohi Khansari, and Yunfei Bai. We’d also like to give special thanks to Ivonne Fajardo, Noah Brown, Benjamin Swanson, Christopher Paguyo, Armando Fuentes, and Sphurti More for overseeing the robot operations. We thank Paul Wohlhart, Konstantinos Bousmalis, Daniel Kappler, Alexander Herzog, Anthony Brohan, Yao Lu, Chad Richards, Vincent Vanhoucke, and Mrinal Kalakrishnan, Max Braun and others in the Robotics at Google team and the Everyday Robot Project for valuable discussions and help.

Categories
Offsites

A Browsable Petascale Reconstruction of the Human Cortex

In January 2020 we released the fly “hemibrain” connectome — an online database providing the morphological structure and synaptic connectivity of roughly half of the brain of a fruit fly (Drosophila melanogaster). This database and its supporting visualization has reframed the way that neural circuits are studied and understood in the fly brain. While the fruit fly brain is small enough to attain a relatively complete map using modern mapping techniques, the insights gained are, at best, only partially informative to understanding the most interesting object in neuroscience — the human brain.

Today, in collaboration with the Lichtman laboratory at Harvard University, we are releasing the “H01” dataset, a 1.4 petabyte rendering of a small sample of human brain tissue, along with a companion paper, “A connectomic study of a petascale fragment of human cerebral cortex.” The H01 sample was imaged at 4nm-resolution by serial section electron microscopy, reconstructed and annotated by automated computational techniques, and analyzed for preliminary insights into the structure of the human cortex. The dataset comprises imaging data that covers roughly one cubic millimeter of brain tissue, and includes tens of thousands of reconstructed neurons, millions of neuron fragments, 130 million annotated synapses, 104 proofread cells, and many additional subcellular annotations and structures — all easily accessible with the Neuroglancer browser interface. H01 is thus far the largest sample of brain tissue imaged and reconstructed in this level of detail, in any species, and the first large-scale study of synaptic connectivity in the human cortex that spans multiple cell types across all layers of the cortex. The primary goals of this project are to produce a novel resource for studying the human brain and to improve and scale the underlying connectomics technologies.

Petabyte connectomic reconstruction of a volume of human neocortex. Left: Small subvolume of the dataset. Right: A subgraph of 5000 neurons and excitatory (green) and inhibitory (red) connections in the dataset. The full graph (connectome) would be far too dense to visualize.

What is the Human Cortex?
The cerebral cortex is the thin surface layer of the brain found in vertebrate animals that has evolved most recently, showing the greatest variation in size among different mammals (it is especially large in humans). Each part of the cerebral cortex is six layered (e.g., L2), with different kinds of nerve cells (e.g., spiny stellate) in each layer. The cerebral cortex plays a crucial role in most higher level cognitive functions, such as thinking, memory, planning, perception, language, and attention. Although there has been some progress in understanding the macroscopic organization of this very complicated tissue, its organization at the level of individual nerve cells and their interconnecting synapses is largely unknown.

Human Brain Connectomics: From Surgical Biopsy to a 3D Database
Mapping the structure of the brain at the resolution of individual synapses requires high-resolution microscopy techniques that can image biochemically stabilized (fixed) tissue. We collaborated with brain surgeons at Massachusetts General Hospital in Boston (MGH) who sometimes remove pieces of normal human cerebral cortex when performing a surgery to cure epilepsy in order to gain access to a site in the deeper brain where an epileptic seizure is being initiated. Patients anonymously donated this tissue, which is normally discarded, to our colleagues in the Lichtman lab. The Harvard researchers cut the tissue into ~5300 individual 30 nanometer sections using an automated tape collecting ultra-microtome, mounted those sections onto silicon wafers, and then imaged the brain tissue at 4 nm resolution in a customized 61-beam parallelized scanning electron microscope for rapid image acquisition.

Imaging the ~5300 physical sections produced 225 million individual 2D images. Our team then computationally stitched and aligned this data to produce a single 3D volume. While the quality of the data was generally excellent, these alignment pipelines had to robustly handle a number of challenges, including imaging artifacts, missing sections, variation in microscope parameters, and physical stretching and compression of the tissue. Once aligned, a multiscale flood-filling network pipeline was applied (using thousands of Google Cloud TPUs) to produce a 3D segmentation of each individual cell in the tissue. Additional machine learning pipelines were applied to identify and characterize 130 million synapses, classify each 3D fragment into various “subcompartments” (e.g., axon, dendrite, or cell body), and identify other structures of interest such as myelin and cilia. Automated reconstruction results were imperfect, so manual efforts were used to “proofread” roughly one hundred cells in the data. Over time, we expect to add additional cells to this verified set through additional manual efforts and further advances in automation.

The H01 volume: roughly one cubic millimeter of human brain tissue captured in 1.4 petabytes of images.

The imaging data, reconstruction results, and annotations are viewable through an interactive web-based 3D visualization interface, called Neuroglancer, that was originally developed to visualize the fruit fly brain. Neuroglancer is available as open-source software, and widely used in the broader connectomics community. Several new features were introduced to support analysis of the H01 dataset, in particular support for searching for specific neurons in the dataset based on their type or other properties.

   
The volume spans all six cortical layers   Highlighting Layer 2 interneurons   Excitatory and inhibitory incoming synapses
   
Neuronal subcompartments classified   A Chandelier cell and some of the Pyramidal neurons it inhibits   Blood vessels traced throughout the volume
   
Serial contact between a pair of neurons   An axon with elaborate whorl structures   A neuron with unusual propensity for self-contact (Credit: Rachael Han)
The Neuroglancer interface to the H01 volume and annotations. The user can select specific cells on the basis of their layer and type, can view incoming and outgoing synapses for the cell, and much more. (Click on the images above to take you to the Neuroglancer view shown.)

Analysis of the Human Cortex
In a companion preprint, we show how H01 has already been used to study several interesting aspects of the organization of the human cortex. In particular, new cell types have been discovered, as well as the presence of “outlier” axonal inputs, which establish powerful synaptic connections with target dendrites. While these findings are a promising start, the vastness of the H01 dataset will provide a basis for many years of further study by researchers interested in the human cortex.

In order to accelerate the analysis of H01, we also provide embeddings of the H01 data that were generated by a neural network trained using a variant of the SimCLR self-supervised learning technique. These embeddings provide highly informative representations of local parts of the dataset that can be used to rapidly annotate new structures and develop new ways of clustering and categorizing brain structures according to purely data-driven criteria. We trained these embeddings using Google Cloud TPU pods and then performed inference at roughly four billion data locations spread throughout the volume.

Managing Dataset Size with Improved Compression
H01 is a petabyte-scale dataset, but is only one-millionth the volume of an entire human brain. Serious technical challenges remain in scaling up synapse-level brain mapping to an entire mouse brain (500x bigger than H01), let alone an entire human brain. One of these challenges is data storage: a mouse brain could generate an exabyte worth of data, which is costly to store. To address this, we are today also releasing a paper, “Denoising-based Image Compression for Connectomics”, that details how a machine learning-based denoising strategy can be used to compress data, such as H01, at least 17-fold (dashed line in the figure below), with negligible loss of accuracy in the automated reconstruction.

Reconstruction quality of noisy and denoised images as a function of compression rate for JPEG XL (JXL) and AV Image Format (AVIF) codecs. Points and lines show the means, and the shaded area covers ±1 standard deviation around the mean.

Random variations in the electron microscopy imaging process lead to image noise that is difficult to compress even in principle, as the noise lacks spatial correlations or other structure that could be described with fewer bytes. Therefore we acquired images of the same piece of tissue in both a “fast” acquisition regime (resulting in high amounts of noise) and a “slow” acquisition regime (resulting in low amounts of noise) and then trained a neural network to infer “slow” scans from “fast” scans. Standard image compression codecs were then able to (lossily) compress the “virtual” slow scans with fewer artifacts compared to the raw data. We believe this advance has the potential to significantly mitigate the costs associated with future large scale connectomics projects.

Next Steps
But storage is not the only problem. The sheer size of future data sets will require developing new strategies for researchers to organize and access the rich information inherent in connectomic data. These are challenges that will require new modes of interaction between humans and the brain mapping data that will be forthcoming.

Categories
Offsites

CodeReading – 3. ABC

Code Reading은 잘 작성되어 있는 프레임워크, 라이브러리, 툴킷 등의 다양한 프로젝트의 내부를 살펴보는 시리즈 입니다. 프로젝트의 아키텍처, 디자인철학이나 코드 스타일 등을 살펴보며, 구체적으로 하나하나 살펴보는 것이 아닌 전반적이면서 간단하게 살펴봅니다.

Series.


이번에 다뤄보고자 하는 라이브러리는 기본적인 추상화 기능을 제공하는 abc 에 대해서 알아보고자 합니다. Python은 동적 언어로서, 객체 지향과 함수형 등 다양한 패러다임을 지원하고 있습니다. abc 모듈은 여기서 객체 지향 프로그래밍을 위한 것입니다. 그럼 라이브러리의 안을 살펴보기 전에 간단하게 객체 지향에서의 추상화에 대해서 짚고 넘어겠습니다.

객체지향에서의 추상화

추상화에 대해서 «오브젝트»에서는 이렇게 이야기를 하고 있습니다.

추상화란 어떤 양상, 세부사항, 구조를 좀 더 명확하게 이해하기 위해 특정 절차나 물체를 의도적으로 생략하거나 감춤으로써 복잡도를 극복하는 방법이다.[Kramer07]

  • 추상화에 의존하라 중에서

images

오브젝트의 영화예매 시스템 설계 예시 (출처: 위키북스)

위의 다이어그램을 보면, 영화에는 할인정책이 있고 정책에는 조건들이 있다는 것을 이해할 수 있습니다. 이와 같이 추상화된 객체들 간의 협력을 통해서 직관적으로 이해할 수 있게 됩니다.

그리고 새로운 할인 정책 혹은 조건이 추가되어도 기존의 코드를 수정하지 않고 기능을 확장할 수 있게 되는 유연함 또한 추상화의 장점입니다.

Abstract Base Class(ABC)

이러한 추상화의 장점들을 사용하기 위해서 PEP3119 를 통해서, Python 창시자인 귀도 반 로섬이 제안하였습니다.

PEP3119

Rationale 부분을 보면, 다음과 같이 OOP에서 객체와 상호작용하는 방식에는 2가지 종류가 있다고 이야기하고 있습니다. 첫 번째로 Invocation (호출) 그리고 Inspection (검사) 입니다.

호출은 OOP 에서 상속, 합성등의 다형성에 의해서 호출되는 메서드를 의미합니다. Python에서는 mro() 를 통해서 메서드 호출 순서를 확인할 수가 있습니다. 이 호출을 통해서 코드 재사용이 가능해지는 것이죠.

class A:
    pass

class B(A):
    pass

class C(A):
    pass

class D(B, C):
    pass

>>> D.__mro__
(__main__.D, __main__.B, __main__.C, __main__.A, object)

다음으로 검사는 해당 객체가 어떤 클래스의 인스턴스인지 혹은 서브클래스인지, 외부에서 호출하는 속성값을 가지고 있는지, 또는 매서드를 가지고 있는지를 확인하여 해당 객체가 주어진 메시지를 처리할 수 있음을 의미합니다.

Code

abc 모듈이 지원하는 기능은 크게 2가지가 있습니다.

  1. 구현을 강제하는 @abstractmethod
  2. 상속을 받은 객체를 서브클래스로 판단하는 것

그렇다면 차례대로 2가지 기능이 어떻게 구현되어 있는지 살펴보겠습니다.

@abstractmethod

# https://github.com/python/cpython/blob/3.9/Lib/abc.py#L7

def abstractmethod(funcobj):
    """A decorator indicating abstract methods.
    ...
    Usage:
        class C(metaclass=ABCMeta):
            @abstractmethod
            def my_abstract_method(self, ...):
                ...
    """
    funcobj.__isabstractmethod__ = True
    return funcobj

위와 같이 메서드에 abstract 여부만 체크해주고, 이 플래그를 이용해서 동작하게 되는 로직들은 Usage에 있는 것처럼, ABCMeta 에 구현이 되어있습니다. 이어서 다음 코드도 한 번 살펴보겠습니다.

# https://github.com/python/cpython/blob/3.9/Lib/_py_abc.py#L14

class ABCMeta(type):
   """Metaclass for defining Abstract Base Classes (ABCs).
   ...
   """

    _abc_invalidation_counter = 0

    def __new__(mcls, name, bases, namespace, /, **kwargs):
        cls = super().__new__(mcls, name, bases, namespace, **kwargs)
        # Compute set of abstract method names
        abstracts = {name
                     for name, value in namespace.items()
                     if getattr(value, "__isabstractmethod__", False)}
        for base in bases:
            for name in getattr(base, "__abstractmethods__", set()):
                value = getattr(cls, name, None)
                if getattr(value, "__isabstractmethod__", False):
                    abstracts.add(name)
        cls.__abstractmethods__ = frozenset(abstracts)
        ...

__new__ 는 Python의 built-in function 중에 하나로서, 객체가 생성될 때의 해당 로직들이 실행됩니다. 해당 부분의 코드를 보면 __isabstractmethod__ 여부를 체크해서 abstracts 를 구성하는 것을 알 수가 있습니다. 그렇지만 내부에서 따로 이 abstracts 여부를 확인하지는 않는 것 같아보였는데, 이 부분은 typeobject.c 코드에서 확인이 가능합니다.

// https://github.com/python/cpython/blob/3.9/Objects/typeobject.c#L3863

static PyObject *
object_new(PyTypeObject *type, PyObject *args, PyObject *kwds)
{
    ...
    abstract_methods = type_abstractmethods(type, NULL);
    ...  // 체크 후 조건이 충족되지 않으면
    PyErr_Format(PyExc_TypeError,
                     "Can't instantiate abstract class %s "
                     "with abstract method%s %U",
                     type->tp_name,
                     method_count > 1 ? "s" : "",
                     joined);

# 예시코드

from abc import ABCMeta

class A(metaclass=ABCMeta):

    def __init__(self):
        pass

    @abstractmethod
    def test(self):
        pass

class B(A):

    def __init__(self):
        pass    

>>> b = B()
TypeError: Can't instantiate abstract class B with abstract methods test

예를 들면, abstractmethodtest 는 구현을 해야하는데, B 클래스 안에서 구현이 되어있지 않기 때문에 에러메시지가 뜨게 되는 것이죠.

subclass

추상 클래스를 상속받아서 구현하게 되는 경우, 이 클래스는 추상 클래스의 서브클래스가 됩니다.
서브클래스 판단 또한 간단하게 되어있습니다. 다시 ABCMeta__new__ 부분으로 돌아가보겠습니다.

# https://github.com/python/cpython/blob/3.9/Lib/_py_abc.py#L48
 
  _abc_invalidation_counter = 0

  def __new__(...):
      ...
      # Set up inheritance registry
      cls._abc_registry = WeakSet()
      cls._abc_cache = WeakSet()
      cls._abc_negative_cache = WeakSet()
      cls._abc_negative_cache_version = ABCMeta._abc_invalidation_counter
      return cls

cls 즉, 클래스의 속성으로 사용되고 있는 값들은 모두 서브클래스를 관리하기 위함입니다. 간단하게 역할을 살펴보면 다음과 같습니다.

  • cls._abc_registry : register 메서드를 통해서 서브클래스를 등록
  • cls._abc_cache : 서브클래스일 경우 캐싱하는 용도
  • cls._abc_negative_cache : 서브클래스가 아닌 경우를 캐싱하는 용도

추가적으로 살펴볼 것은 자료구조로 사용하고 있는 WeekSet 입니다. 약한 참조를 지원하는 weekref 모듈을 통해서 구성된 Set 자료구조입니다. 약한 참조란 무엇이고, 여기서 약한 참조가 왜 사용되었을까요?

흔히 강한 참조 (Strong Reference)와 약한 참조 (Weak Reference)로 나누어서 볼 수가 있는데, 이는 GC(Garbage Collection)에 의해서 사라지느냐 마느냐의 차이로 볼 수 있습니다. 강한 참조의 경우는 참조수(reference count)가 0이 되거나 메모리에서 해제될 때 제거되고, 약한 참조의 경우에는 참조수를 올리지 않기 때문에 GC에 의해서 매번 제거가 됩니다.

이렇게 쉽게 제거될 수 있는 성질은 Cache에 사용이 됩니다. Cache는 자주 등장하는 경우를 빠르게 처리할 수 있고, 제거가 되더라도 문제가 발생하지 않기 때문입니다. 그리고 메모리 누수를 미리 방지하기 위해서 사용하고 있다고 볼 수 있습니다.

추가적으로 negative cache 의 경우, DNS에서 존재하지 않는 호스트에 대한 요청을 캐싱하여 빠르게 답을 해주는 용도로 사용되는 방식입니다. 서브클래스 체크 또한 다양한 클래스와 비교를 하게 될 것이기 때문에, negative cache까지 구현되어 있는 것으로 이해가 됩니다. 비슷한 상황에서 써먹을 수 있을 것 같네요.

# https://github.com/python/cpython/blob/3.9/Lib/_py_abc.py#L54

def register(cls, subclass):
    """Register a virtual subclass of an ABC."""

# https://github.com/python/cpython/blob/3.9/Lib/_py_abc.py#L108

def __subclasscheck__(cls, subclass):
    """Override for issubclass(subclass, cls)."""

마지막으로 서브클래스 관련해서는 주요 메서드인 등록(register)과 체크정도(__subclasscheck__)가 있습니다. 내부의 코드는 단순한 편이라서 굳이 다루지 않아도 괜찮을 것 같습니다.

collections.abc

흔히 자주 사용되는 collections 에서도 이 abc 이 적용되어 있습니다. 바로 collections.abc 입니다. 여기에는 기본적인 자료구조들에 대한 추상 클래스를 제공하고 있습니다. 문서에 있는 리스트를 한번 살펴보겠습니다.

images

collection.abc의 다이어그램 (출처: Issue Tracker – Python.org)

위 클래스를 상속해서 사용한다면, 해당 클래스에 맞춰서 메서드들을 구현해야 합니다. 굉장히 자주 쓰이는, 기본적인 자료구조형의 추상 베이스 클래스들이므로, 직관적으로 사용할 수 있을 것이라고 기대가 됩니다.

여기에 대한 코드는 여기에서 확인이 가능합니다. 간단히 정리하면 Metaclass가 믹스인으로 사용되고 , 서브클래스 체크용으로 __subclasshook__ 에서 메서드들을 확인하도록 되어있습니다.

끝으로

Python에서 지원하는 추상화 모듈인 abc에 대해서 코드와 함께 알아보았습니다. 조금 더 Pythonic 한 코드를 구현하고 싶다면, 위의 collections.abc 의 기본 추상화 클래스를 상속받아 필요한 기능들을 구현해서 사용해보는 것이 어떨까요?

References

Categories
Offsites

Cross-Modal Contrastive Learning for Text-to-Image Generation

Automatic text-to-image synthesis, in which a model is trained to generate images from text descriptions alone, is a challenging task that has recently received significant attention. Its study provides rich insights into how machine learning (ML) models capture visual attributes and relate them to text. Compared to other kinds of inputs to guide image creation, such as sketches, object masks or mouse traces (which we have highlighted in prior work), descriptive sentences are a more intuitive and flexible way to express visual concepts. Hence, a strong automatic text-to-image generation system can also be a useful tool for rapid content creation and could be applied to many other creative applications, similar to other efforts to integrate machine learning into the creation of art (e.g., Magenta).

State-of-the-art image synthesis results are typically achieved using generative adversarial networks (GANs), which train two models — a generator, which tries to create realistic images, and a discriminator, which tries to determine if an image is real or fabricated. Many text-to-image generation models are GANs that are conditioned using text inputs in order to generate semantically relevant images. This is significantly challenging, especially when long, ambiguous descriptions are provided. Moreover, GAN training can be prone to mode collapse, a common failure case for the training process in which the generator learns to produce only a limited set of outputs, so that the discriminator fails to learn robust strategies to recognize fabricated images. To mitigate mode collapse, some approaches use multi-stage refinement networks that iteratively refine an image. However, such systems require multi-stage training, which is less efficient than simpler single-stage end-to-end models. Other efforts rely on hierarchical approaches that first model object layouts before finally synthesizing a realistic image. This requires the use of labeled segmentation data, which can be difficult to obtain.

In “Cross-Modal Contrastive Learning for Text-to-Image Generation,” to appear at CVPR 2021, we present the Cross-Modal Contrastive Generative Adversarial Network (XMC-GAN), which addresses text-to-image generation by learning to maximize the mutual information between image and text using inter-modal (image-text) and intra-modal (image-image) contrastive losses. This approach helps the discriminator to learn more robust and discriminative features, so XMC-GAN is less prone to mode collapse even with one-stage training. Importantly, XMC-GAN achieves state-of-the-art performance with a simple one-stage generation, as compared to previous multi-stage or hierarchical approaches. It is end-to-end trainable, and only requires image-text pairs (as opposed to labeled segmentation or bounding box data).

Contrastive Losses for Text-to-Image Synthesis
The goal of text-to-image synthesis systems is to produce clear, photo-realistic scenes with high semantic fidelity to their conditioned text descriptions. To achieve this, we propose to maximize the mutual information between the corresponding pairs: (1) images (real or generated) with a sentence describing the scene; (2) a generated image and a real image with the same description; and (3) regions of an image (real or generated) and words or phrases associated with them.

In XMC-GAN, this is enforced using contrastive losses. Similar to other GANs, XMC-GAN contains a generator for synthesizing images, and a discriminator that is trained to act as a critic between real and generated images. Three sets of data contribute to the contrastive loss in this system — the real images, the text that describes those images, and the images generated from the text descriptions. The individual loss functions for both the generator and the discriminator are combinations of the loss calculated from whole images with the full text description, combined with the loss calculated from sub-divided images with associated words or phrases. Then, for each batch of training data, we calculate the cosine similarity score between each text description and the real images, and likewise, between each text description and the batch of generated images. The goal is for the matching pairs (both text-to-image and real image-to-generated image) to have high similarity scores and for non-matching pairs to have low scores. Enforcing such a contrastive loss allows the discriminator to learn more robust and discriminative features.

Inter-modal and intra-modal contrastive learning in our proposed XMC-GAN text-to-image synthesis model.

Results
We apply XMC-GAN to three challenging datasets — the first was a collection of MS-COCO descriptions of MS-COCO images, and the other two were datasets annotated with Localized Narratives, one of which covers MS-COCO images (which we call LN-COCO) and the other of which describes Open Images data (LN-OpenImages). We find that XMC-GAN achieves a new state of the art on each. The images generated by XMC-GAN depict scenes that are of higher quality than those generated using other techniques. On MS-COCO, XMC-GAN improves the state-of-the-art Fréchet inception distance (FID) score from 24.7 to 9.3, and is significantly preferred by human evaluators.

Selected qualitative results for generated images on MS-COCO.

Similarly, human raters prefer the image quality in XMC-GAN generated images 77.3% of the time, and 74.1% prefer its image-text alignment compared to three other state-of-the-art approaches (CP-GAN, SD-GAN, and OP-GAN) .

Human evaluation on MS-COCO for image quality and text alignment. Annotators rank (anonymized and order-randomized) generated images from best to worst.

XMC-GAN also generalizes well to the challenging Localized Narratives dataset, which contains longer and more detailed descriptions. Our prior work TReCS tackles text-to-image generation for Localized Narratives using mouse trace inputs to improve image generation quality. Despite not receiving mouse trace annotations, XMC-GAN is able to significantly outperform TReCS on image generation on LN-COCO, improving state-of-the-art FID from 48.7 to 14.1. Incorporating mouse traces and other additional inputs into an end-to-end model such as XMC-GAN would be interesting to study in future work.

In addition, we also train and evaluate on the LN-OpenImages, which is more challenging than MS-COCO because the dataset is much larger with images that cover a broader range of subject matter and that are more complex (8.4 objects on average). To the best of our knowledge, XMC-GAN is the first text-to-image synthesis model that is trained and evaluated on Open Images. XMC-GAN is able to generate high quality results, and sets a strong benchmark FID score of 26.9 on this very challenging task.

Random samples of real and generated images on Open Images.

Conclusion and Future Work
In this work, we present a cross-modal contrastive learning framework to train GAN models for text-to-image synthesis. We investigate several cross-modal contrastive losses that enforce correspondence between image and text. For both human evaluations and quantitative metrics, XMC-GAN establishes a marked improvement over previous models on multiple datasets. It generates high quality images that match their input descriptions well, including for long, detailed narratives, and does so while being a simpler, end-to-end model. We believe that this represents a significant advance towards creative applications for image generation from natural language descriptions. As we continue this research, we are continually evaluating responsible approaches, potential applications and risk mitigation, in accordance with our AI Principles.

Acknowledgements
This is a joint work with Jason Baldridge, Honglak Lee, and Yinfei Yang. We would like to thank Kevin Murphy, Zizhao Zhang, Dilip Krishnan for their helpful feedback. We also want to thank the Google Data Compute team for their work on conducting human evaluations. We are also grateful for general support from the Google Research team.

Categories
Offsites

Does Volatility Harvesting Really Work?

Categories
Offsites

Understanding Contextual Facial Expressions Across the Globe

It might seem reasonable to assume that people’s facial expressions are universal — so, for example, whether a person is from Brazil, India or Canada, their smile upon seeing close friends or their expression of awe at a fireworks display would look essentially the same. But is that really true? Is the association between these facial expressions and their relevant context across geographies indeed universal? What can similarities — or differences — between the situations where someone grins or frowns tell us about how people may be connected across different cultures?

Scientists seeking to answer these questions and to uncover the extent to which people are connected across cultures and geography often use survey-based studies that can rely heavily on local language, norms, and values. However, such studies are not scalable, and often end up with small sample sizes and inconsistent findings.

In contrast to survey-based studies, studying patterns of facial movement provides a more direct understanding of expressive behavior. But analyzing how facial expressions are actually used in everyday life would require researchers to go through millions of hours of real-world footage, which is too time-consuming to do manually. In addition, facial expressions and the contexts in which they are exhibited are complicated, requiring large sample sizes in order to make statistically sound conclusions. While existing studies have produced diverging answers to the question of the universality of facial expressions in given contexts, applying machine learning (ML) in order to appropriately scale the research has the potential to provide clarity.

In “Sixteen facial expressions occur in similar contexts worldwide”, published in Nature, we present research undertaken in collaboration with UC Berkeley to conduct the first large-scale worldwide analysis of how facial expressions are actually used in everyday life, leveraging deep neural networks (DNNs) to drastically scale up expression analysis in a responsible and thoughtful way. Using a dataset of six million publicly available videos across 144 countries, we analyze the contexts in which people use a variety of facial expressions and demonstrate that rich nuances in facial behavior — including subtle expressions — are used in similar social situations around the world.

A Deep Neural Network Measuring Facial Expression
Facial expressions are not static. If one were to examine a person’s expression instant by instant, what might at first appear to be “anger”, may instead end up being “awe”, “surprise” or “confusion”. The interpretation depends on the dynamics of a person’s face as their expression presents itself. The challenge in building a neural network to understand facial expressions, then, is that it must interpret the expression within its temporal context. Training such a system requires a large and diverse, cross-cultural dataset of videos with fully annotated expressions.

To build the dataset, skilled raters manually searched through a broad collection of publicly available videos to identify those likely to contain clips covering all of our pre-selected expression categories. To ensure that the videos matched the region they were assumed to represent, preference in video selection was given to those that included the geographic location of origin. The faces in the videos were then found using a deep convolutional neural network (CNN) — similar to the Google Cloud Face Detection API — that follows faces over the course of the clip using a method based on traditional optical flow. Using an interface similar to Google Crowdsource, annotators then labeled facial expressions across 28 distinct categories if present at any point during the clip. Because the goal was to sample how an average person would perceive an expression, the annotators were not coached or trained, nor were they provided examples or definitions of the target expressions. We discuss additional experiments to evaluate whether the model trained from these annotations was biased below.

Raters were presented videos with a single face highlighted for their attention. They observed the subject throughout the duration of the clip and annotated the facial expressions they exhibited. (source video)

The face detection algorithm established a sequence of locations of each face throughout the video. We then used a pre-trained Inception network to extract features representing the most salient aspects of facial expressions from the faces. The features were then fed into a long short-term memory (LSTM) network, a type of recurrent neural network that is able to model how a facial expression might evolve over time due to its ability to remember salient information from the past.

In order to ensure that the model was making consistent predictions across a range of demographic groups, we evaluated the model fairness on an existing dataset that was constructed using similar facial expression labels, targeting a subset of 16 expressions on which it exhibited the best performance.

The model’s performance was consistent across all of the demographic groups represented in the evaluation dataset, which provides supporting evidence that the model trained to annotated facial expressions is not measurably biased. The model’s annotations of those 16 facial expressions across 1,500 images can be explored here.

We modeled the selected face in each video by using a CNN to extract features from the face at each frame, which were then fed into an LSTM network to model the changes in the expression over time. (source video)

Measuring the Contexts Captured in Videos
To understand the context of facial expressions across millions of videos, we used DNNs that could capture the fine-grained content and automatically recognize the context. The first DNN modeled a combination of text features (title and description) associated with a video along with the actual visual content (video-topic model). In addition, we used a DNN that only relied on text features without any visual information (text-topic model). These models predict thousands of labels describing the videos. In our experiments these models were able to identify hundreds of unique contexts (e.g., wedding, sporting event, or fireworks) showcasing the diversity of the data we used for the analysis.

The Covariation Between Expressions and Contexts Around the World
In our first experiment, we analyzed 3 million public videos captured on mobile phones. We chose to focus on mobile uploads because they are more likely to contain natural expressions. We correlated the facial expressions that occurred in the videos to the context annotations derived from the video-topic model. We found 16 kinds of facial expressions had distinct associations with everyday social contexts that were consistent across the world. For instance, the expressions that people associate with amusement occurred more often in videos with practical jokes; expressions that people associate with awe, in videos with fireworks; and triumph, with sporting events. These results have strong implications for discussions about the relative importance of psychologically relevant context in facial expression, compared to other factors, such as those unique to an individual, culture, or society.

Our second experiment analyzed a separate set of 3 million videos, but this time we annotated the contexts with the text-topic model. The results verified that the findings in the first experiment were not driven by subtle influences of facial expressions in the video on the annotations of the video-topic model. In other words we used this experiment to verify our conclusions from the first experiment given the possibility that the video-topic model could implicitly be factoring in facial expressions when computing its content labels.

We correlated the expression and context annotations across all of the videos within each region. Each expression was found to have specific associations with different contexts that were preserved across 12 world regions. For example, here, in red, we can see that expressions people associate with awe were found more often in the context of fireworks, pets, and toys than in other contexts.

In both experiments, the correlations between expressions and contexts appeared to be well-preserved across cultures. To quantify exactly how similar the associations between expressions and contexts were across the 12 different world regions we studied, we computed second-order correlations between each pair of regions. These correlations identify the relationships between different expressions and contexts in each region and then compare them with other regions. We found that 70% of the context–expression associations found in each region are shared across the modern world.

Finally, we asked how many of the 16 kinds of facial expression we measured had distinct associations with different contexts that were preserved around the world. To do so, we applied a method called canonical correlations analysis, which showed that all 16 facial expressions had distinct associations that were preserved across the world.

Conclusions
We were able to examine the contexts in which facial expressions occur in everyday life across cultures at an unprecedented scale. Machine learning allowed us to analyze millions of videos across the world and discover evidence supporting hypotheses that facial expressions are preserved to a degree in similar contexts across cultures.

Our results also leave room for cultural differences. Although the correlations between facial expressions and contexts were 70% consistent around the world, they were up to 30% variable across regions. Neighboring world regions generally had more similar associations between facial expressions and contexts than distant world regions, indicating that the geographic spread of human culture may also play a role in the meanings of facial expressions.

This work shows that we can use machine learning to better understand ourselves and identify common communication elements across cultures. Tools such as DNNs give us the opportunity to provide vast amounts of diverse data in service of scientific discovery, enabling more confidence in the statistical conclusions. We hope our work provides a template for using the tools of machine learning in a responsible way and sparks more innovative research in other scientific domains.

Acknowledgements
Special thanks to our co-authors Dacher Keltner from UC Berkeley, along with Florian Schroff, Brendan Jou, and Hartwig Adam from Google Research. We are also grateful for additional support at Google provided by Laura Rapin, Reena Jana, Will Carter, Unni Nair, Christine Robson, Jen Gennai, Sourish Chaudhuri, Greg Corrado, Brian Eoff, Andrew Smart, Raine Serrano, Blaise Aguera y Arcas, Jay Yagnik, and Carson Mcneil.

Categories
Offsites

KELM: Integrating Knowledge Graphs with Language Model Pre-training Corpora

Large pre-trained natural language processing (NLP) models, such as BERT, RoBERTa, GPT-3, T5 and REALM, leverage natural language corpora that are derived from the Web and fine-tuned on task specific data, and have made significant advances in various NLP tasks. However, natural language text alone represents a limited coverage of knowledge, and facts may be contained in wordy sentences in many different ways. Furthermore, existence of non-factual information and toxic content in text can eventually cause biases in the resulting models.

Alternate sources of information are knowledge graphs (KGs), which consist of structured data. KGs are factual in nature because the information is usually extracted from more trusted sources, and post-processing filters and human editors ensure inappropriate and incorrect content are removed. Therefore, models that can incorporate them carry the advantages of improved factual accuracy and reduced toxicity. However, their different structural format makes it difficult to integrate them with the existing pre-training corpora in language models.

In “Knowledge Graph Based Synthetic Corpus Generation for Knowledge-Enhanced Language Model Pre-training” (KELM), accepted at NAACL 2021, we explore converting KGs to synthetic natural language sentences to augment existing pre-training corpora, enabling their integration into the pre-training of language models without architectural changes. To that end, we leverage the publicly available English Wikidata KG and convert it into natural language text in order to create a synthetic corpus. We then augment REALM, a retrieval-based language model, with the synthetic corpus as a method of integrating natural language corpora and KGs in pre-training. We have released this corpus publicly for the broader research community.

Converting KG to Natural Language Text
KGs consist of factual information represented explicitly in a structured format, generally in the form of [subject entity, relation, object entity] triples, e.g., [10×10 photobooks, inception, 2012]. A group of related triples is called an entity subgraph. An example of an entity subgraph that builds on the previous example of a triple is { [10×10 photobooks, instance of, Nonprofit Organization], [10×10 photobooks, inception, 2012] }, which is illustrated in the figure below. A KG can be viewed as interconnected entity subgraphs.

Converting subgraphs into natural language text is a standard task in NLP known as data-to-text generation. Although there have been significant advances on data-to-text-generation on benchmark datasets such as WebNLG, converting an entire KG into natural text has additional challenges. The entities and relations in large KGs are more vast and diverse than small benchmark datasets. Moreover, benchmark datasets consist of predefined subgraphs that can form fluent meaningful sentences. With an entire KG, such a segmentation into entity subgraphs needs to be created as well.

An example illustration of how the pipeline converts an entity subgraph (in bubbles) into synthetic natural sentences (far right).

In order to convert the Wikidata KG into synthetic natural sentences, we developed a verbalization pipeline named “Text from KG Generator” (TEKGEN), which is made up of the following components: a large training corpus of heuristically aligned Wikipedia text and Wikidata KG triples, a text-to-text generator (T5) to convert the KG triples to text, an entity subgraph creator for generating groups of triples to be verbalized together, and finally, a post-processing filter to remove low quality outputs. The result is a corpus containing the entire Wikidata KG as natural text, which we call the Knowledge-Enhanced Language Model (KELM) corpus. It consists of ~18M sentences spanning ~45M triples and ~1500 relations.

Converting a KG to natural language, which is then used for language model augmentation

Integrating Knowledge Graph and Natural Text for Language Model Pre-training
Our evaluation shows that KG verbalization is an effective method of integrating KGs with natural language text. We demonstrate this by augmenting the retrieval corpus of REALM, which includes only Wikipedia text.

To assess the effectiveness of verbalization, we augment the REALM retrieval corpus with the KELM corpus (i.e., “verbalized triples”) and compare its performance against augmentation with concatenated triples without verbalization. We measure the accuracy with each data augmentation technique on two popular open-domain question answering datasets: Natural Questions and Web Questions.

Augmenting REALM with even the concatenated triples improves accuracy, potentially adding information not expressed in text explicitly or at all. However, augmentation with verbalized triples allows for a smoother integration of the KG with the natural language text corpus, as demonstrated by the higher accuracy. We also observed the same trend on a knowledge probe called LAMA that queries the model using fill-in-the-blank questions.

Conclusion
With KELM, we provide a publicly-available corpus of a KG as natural text. We show that KG verbalization can be used to integrate KGs with natural text corpora to overcome their structural differences. This has real-world applications for knowledge-intensive tasks, such as question answering, where providing factual knowledge is essential. Moreover, such corpora can be applied in pre-training of large language models, and can potentially reduce toxicity and improve factuality. We hope that this work encourages further advances in integrating structured knowledge sources into pre-training of large language models.

Acknowledgements
This work has been a collaborative effort involving Oshin Agarwal, Heming Ge, Siamak Shakeri and Rami Al-Rfou. We thank William Woods, Jonni Kanerva, Tania Rojas-Esponda, Jianmo Ni, Aaron Cohen and Itai Rolnick for rating a sample of the synthetic corpus to evaluate its quality. We also thank Kelvin Guu for his valuable feedback on the paper.